ggplot2를 이용하여 지도 그리기를 해보자. 지도는 shapefile에 담겨져 있다고 가정하자. shapefile을 읽는 방법은 여러가지가 있을 수 있는데 sf 패키지의 st_read 혹은 read_sf 함수를 이용한 후 ggplot2의 geom_sf를 이용하여 그리는 것이 가장 쉬운 것 같다.
library(sf)kor <-st_read("gadm41_KOR_1.shp")
Reading layer `gadm41_KOR_1' from data source
  `C:\Users\jonghoon.kim\Documents\myblog\blog\posts\drawing-map\gadm41_KOR_1.shp'
  using driver `ESRI Shapefile'
Simple feature collection with 17 features and 11 fields
Geometry type: MULTIPOLYGON
Dimension:     XY
Bounding box:  xmin: 124.6097 ymin: 33.11236 xmax: 131.8715 ymax: 38.61177
Geodetic CRS:  WGS 84
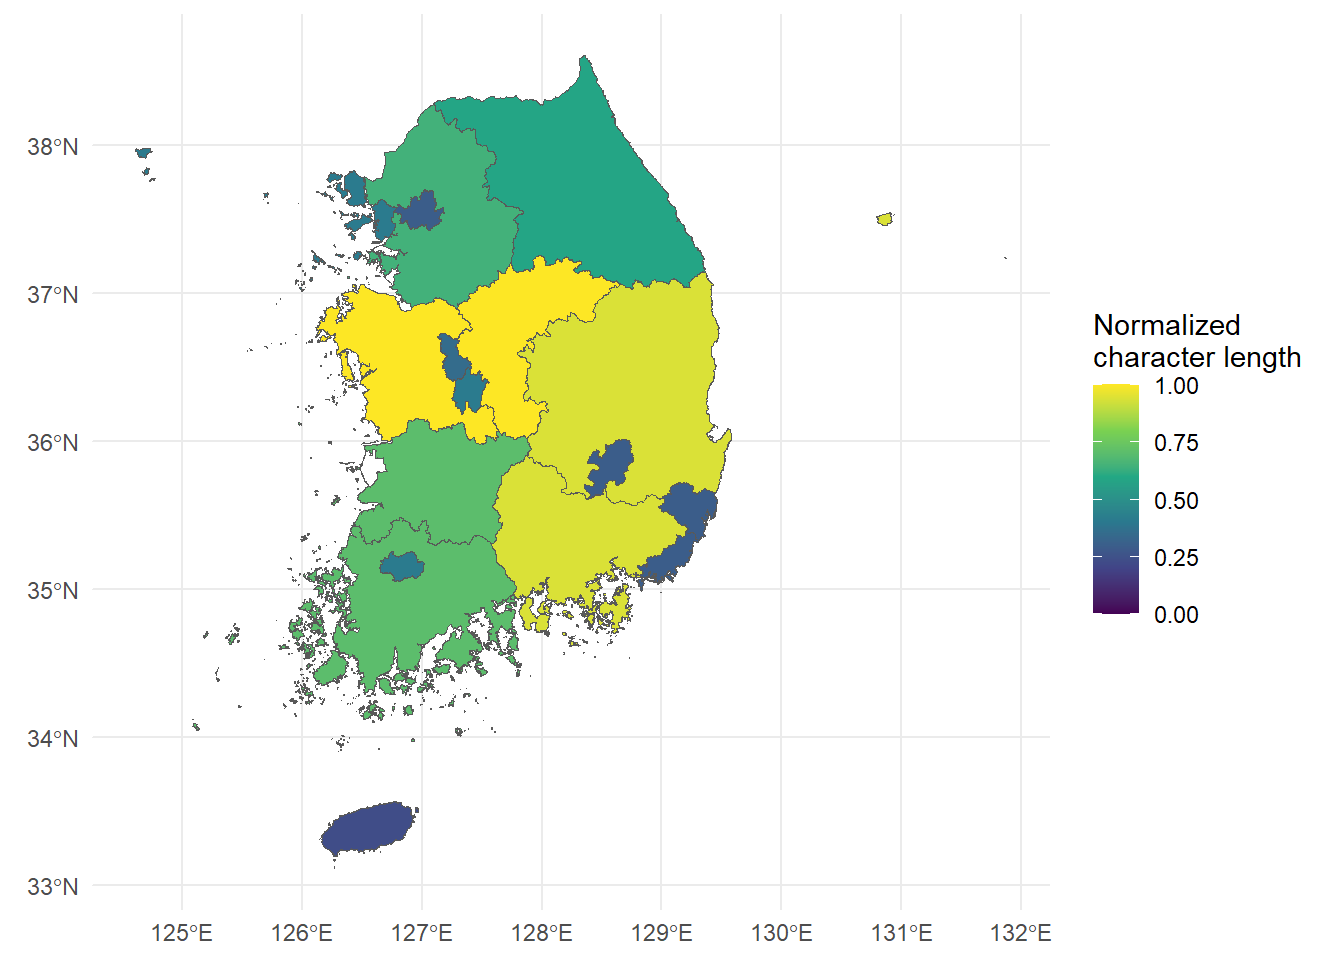
# kor <- read_sf(dsn="C:/Users/jonghoon.kim/Documents/myblog/posts/drawing-map", layer="gadm41_KOR_1")set.seed(42)# normalized number of characters of the name of the admin unit (level 1)char_len <-sapply(kor$NAME_1, nchar)kor$prop_char <- char_len /max(char_len)library(ggplot2)plt <-ggplot(kor)+geom_sf(aes(fill=prop_char))+scale_fill_viridis_c(name="Normalized\ncharacter length", limits=c(0,1)) +theme_minimal()+theme(legend.position="right")plt
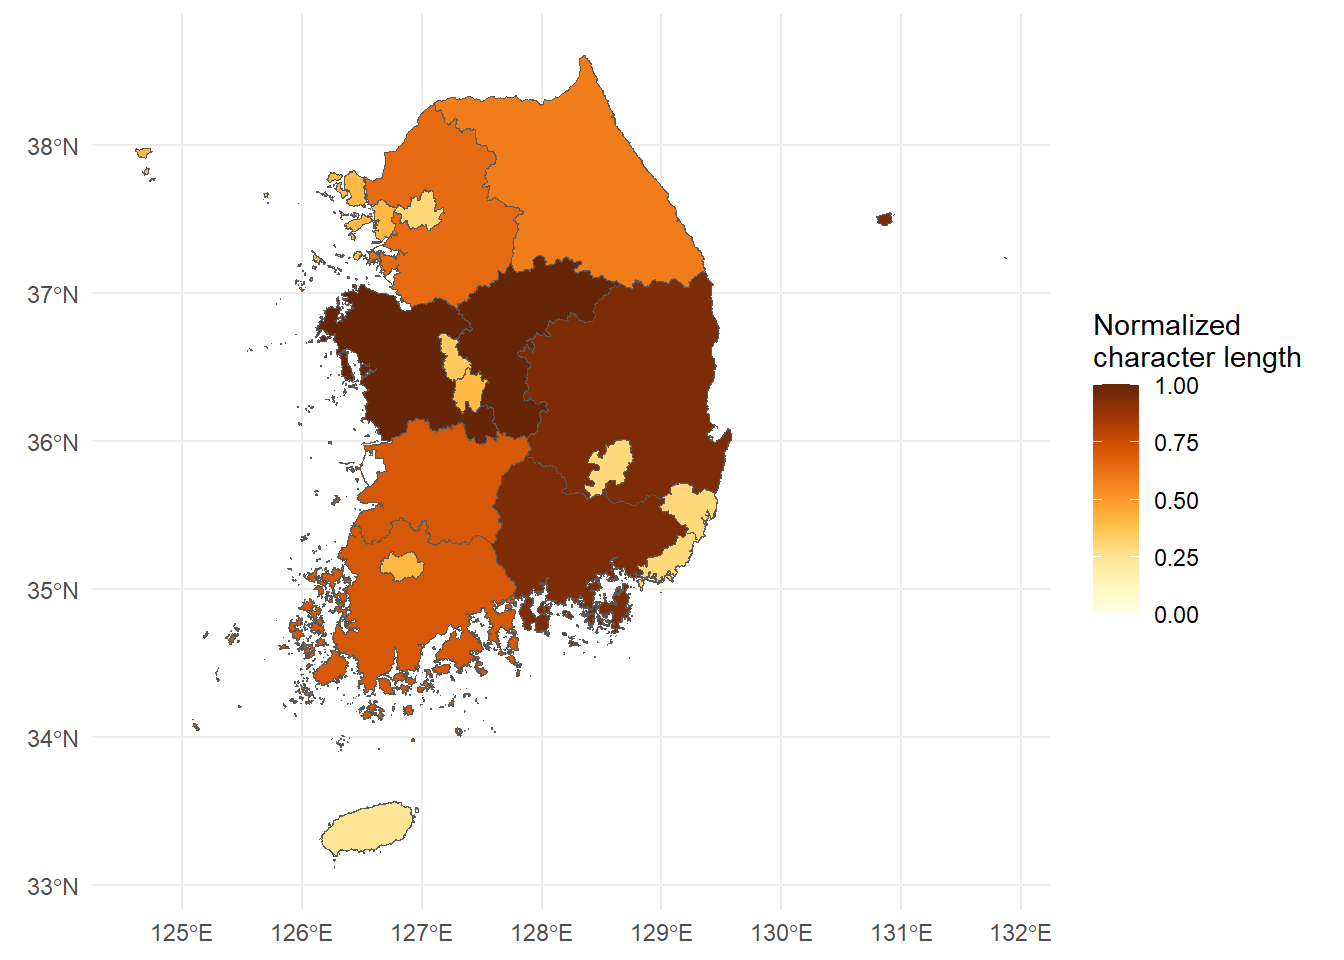
# use color brewer library(RColorBrewer)pal <-brewer.pal(9,"YlOrBr")plt <- plt +scale_fill_gradientn(name="Normalized\ncharacter length", colors=pal, limits=c(0,1))plt
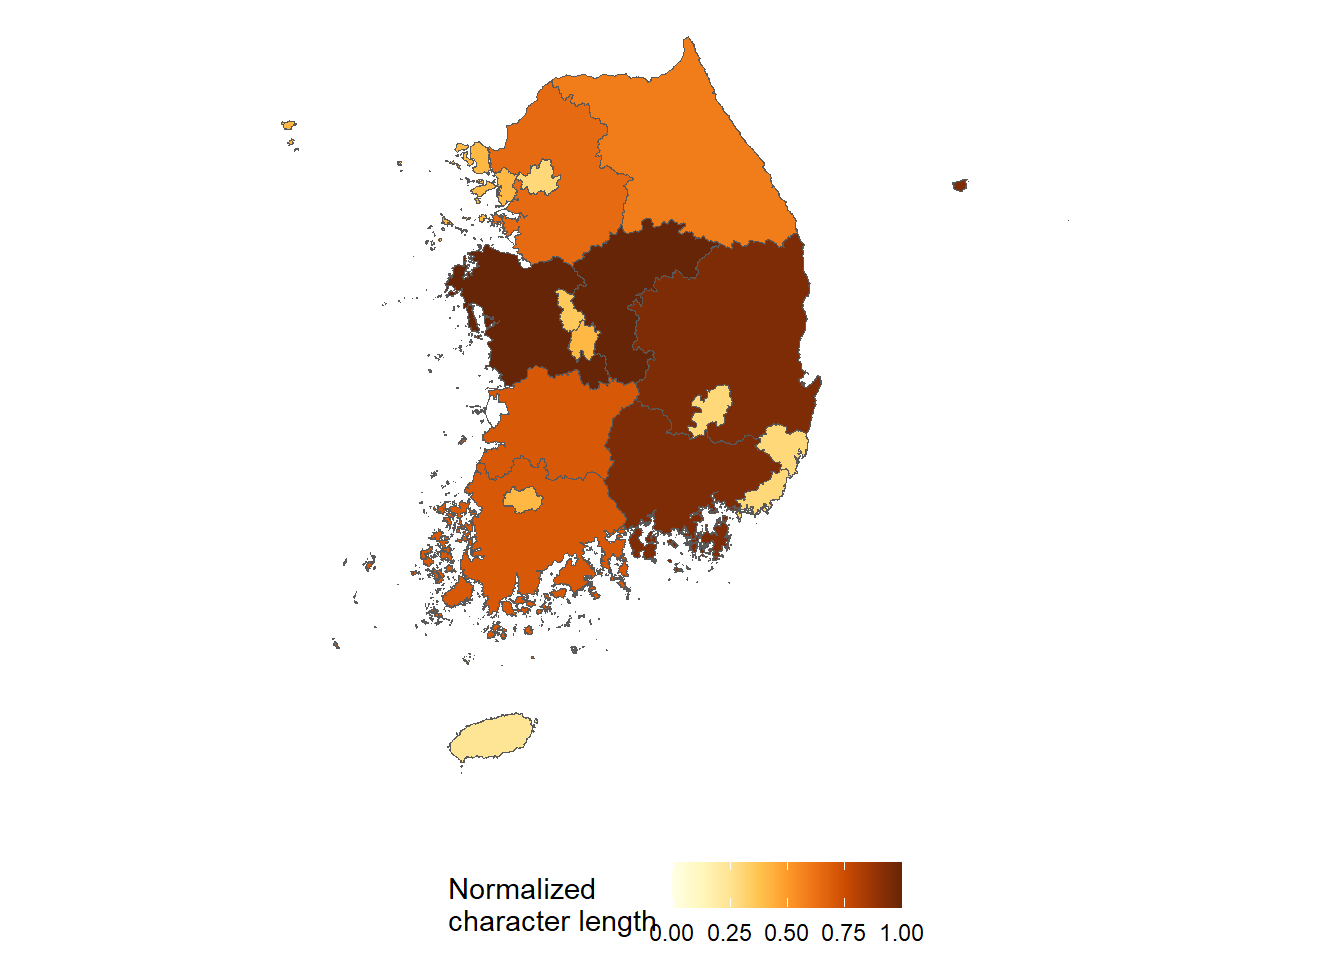
# Clear some background stuffplt <- plt +theme(panel.background =element_blank(), # bg of the panelplot.background =element_blank(), # bg of the plotlegend.background =element_blank(), # get rid of legend bglegend.box.background =element_blank(),panel.spacing =unit(c(0,0,0,0), "null"),plot.margin =unit(c(0,0,0,0), "null"),axis.line =element_blank(),axis.text.x =element_blank(),axis.text.y =element_blank(),axis.ticks =element_blank(),axis.title.x =element_blank(),axis.title.y =element_blank(),panel.border =element_blank(),panel.grid.major =element_blank(),panel.grid.minor =element_blank(),legend.position ="bottom",plot.title =element_text(hjust=0.5, size=12))plt