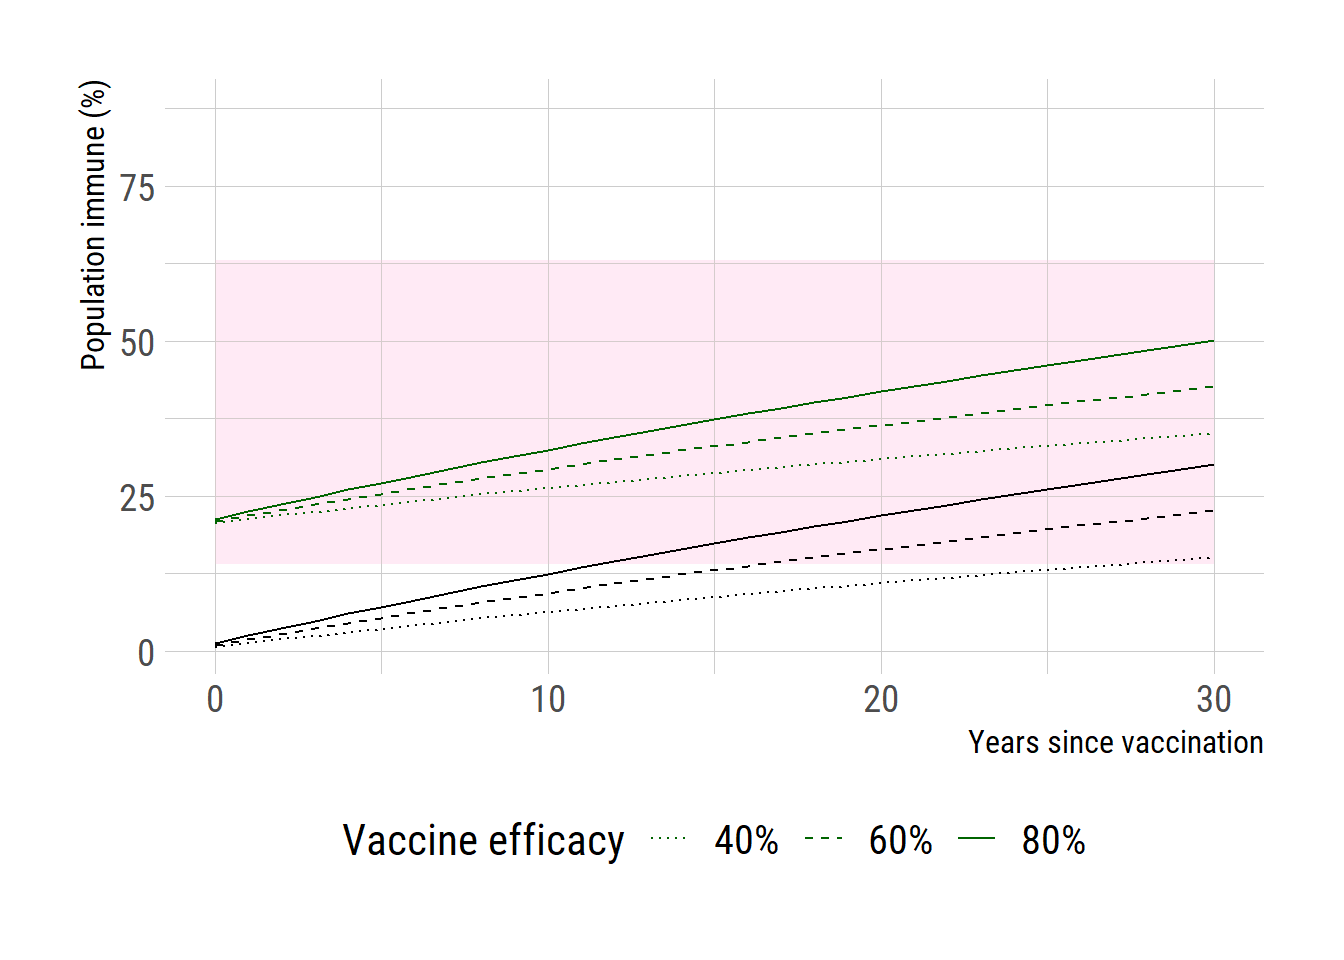
Critical vaccination threshold

vaccine
population immunity
critical vaccination threshold
Author

Jong-Hoon Kim

Published

December 14, 2023

The following article by Fine provides a great introduction to the critical vaccination threshold.

Critical vaccination threshold

The simplest scenario would be to assume that individuals are well-mixed and vaccine recipients are completely protected from infection. For this scenario, the critical threshold for random vaccination, \(V_c\), is as follows: \[ V_c = 1-1/R_0 \] If vaccines are only partially protective and \(E\) fraction of the vaccine recipients are completely protected, \(V_c\) becomes as follows: \[ V_c = \frac{1-1/R_0}{E} \]

I used the population World Population Prospects 2022.

Plot the results

library(ggplot2)
extrafont::loadfonts("win", quiet=TRUE)
theme_set(hrbrthemes::theme_ipsum_rc(base_size=14, subtitle_size=16, axis_title_size=12))
R0 <- seq(1,5,length.out=100)
VE <- c(0.4, 0.6, 0.8)
Vc <- lapply(VE, function(x) ifelse((1-1/R0)/x <= 1.0, 100*(1-1/R0)/x, NA))

df <- data.frame(R0=R0, Vc1=Vc[[1]], Vc2=Vc[[2]], Vc3=Vc[[3]])

gg <- ggplot(df, aes(x = R0)) +
  geom_rect(aes(xmin=1.15, xmax=2.78, ymin=0, ymax=max(df$Vc3)),
                   fill = "pink", alpha=0.01)+
  geom_line(aes(y=Vc3, linetype="80%")) +
  geom_line(aes(y=Vc2, linetype="60%")) +
  geom_line(aes(y=Vc1, linetype="40%")) +
  scale_linetype_manual("Vaccine efficacy", values=c("80%"="solid",
                                   "60%"="dashed", 
                                   "40%"="dotted"))+
  # labs(y="Critical vaccination threshold", x=expression(R[0])) +
  labs(y=expression(paste("Critical vaccination threshold (%), ", V[C])), 
       x=expression(paste("Basic reproduction number, ", R[0]))) +
  theme(text = element_text(size=16),
        axis.text = element_text(size=16),
        legend.text=element_text(size=15), 
        legend.position = "bottom")

gg

# ggsave("Vc_R0.png", gg, units="in", width=3.4*2, height=2.7*2)
R0 <- c(1.15, 2.78)
(Vc <- 1-1/R0)
[1] 0.1304348 0.6402878

India simulation

library(data.table)
library(readxl)
library(dplyr)
# d <- read_xlsx("C:/Users/jonghoon.kim/Documents/myblog/posts/critical_vacc_threshold/WPP2022_POP_F01_1_POPULATION_SINGLE_AGE_BOTH_SEXES.xlsx", sheet= "Medium variant")
# d2 <- d[-(1:11),]
# india <- d2[(d2$...3 == "India" & d2$...11 > 2023),]
# names(india) <- c(1:2, "country", 4:10 ,"year", paste0("age_", 0:100))

# saveRDS(india, "C:/Users/jonghoon.kim/Documents/myblog/posts/critical_vacc_threshold/WPP2022_India.rds")

india <- readRDS("WPP2022_India.rds")
india$year <- as.numeric(india$year)
# india[,paste0("age_", 0:100)] <- as.numeric(india[,paste0("age_", 0:100)])
india <- india %>% mutate_at(paste0("age_", 0:100), as.numeric)

yrs <- 2024:2100
# simulate
VE <- c(0.4, 0.6, 0.8)
prop_immune <- rep(NA, length(yrs))

for(i in seq_along(yrs)) {
  numerator <- sum(india[india$year == yrs[i], paste0("age_", 0:(i-1))])
  denominator <- sum(india[india$year == yrs[i], paste0("age_", 0:100)])
  prop_immune[i] <- numerator / denominator
} 

existing_immune <- 20
pop_immune_ve <- lapply(VE, function(z) 100*z*prop_immune)
# add the existing immunity, assumed to be 15%
pop_immune_ve_added <- lapply(VE, function(z) 100*z*prop_immune + existing_immune)

df <- data.frame(years=yrs-2024, 
                 pi1=pop_immune_ve[[1]], 
                 pi2=pop_immune_ve[[2]], 
                 pi3=pop_immune_ve[[3]], 
                 pi4=pop_immune_ve_added[[1]], 
                 pi5=pop_immune_ve_added[[2]], 
                 pi6=pop_immune_ve_added[[3]])

extrafont::loadfonts("win", quiet=TRUE)
theme_set(hrbrthemes::theme_ipsum_rc(base_size=14, subtitle_size=16, axis_title_size=12))


gg <- ggplot(df, aes(x = years)) +
  geom_rect(aes(xmin=0, xmax=30, ymin=14, ymax=63),
                   fill = "pink", alpha=0.01)+
  geom_line(aes(y=pi3, linetype="80%")) +
  geom_line(aes(y=pi2, linetype="60%")) +
  geom_line(aes(y=pi1, linetype="40%")) +
  geom_line(aes(y=pi6, linetype="80%"), color="dark green") +
  geom_line(aes(y=pi5, linetype="60%"), color="dark green") +
  geom_line(aes(y=pi4, linetype="40%"), color="dark green") +
  scale_x_continuous(limits=c(0,30))+
  scale_linetype_manual("Vaccine efficacy", 
                        values=c("80%"="solid",
                                 "60%"="dashed", 
                                 "40%"="dotted"))+
  # labs(y="Critical vaccination threshold", x=expression(R[0])) +
  labs(y="Population immune (%)", x="Years since vaccination") +
  theme(text = element_text(size=16),
        axis.text = element_text(size=16),
        legend.text=element_text(size=15), 
        legend.position = "bottom")
gg

# ggsave("immune_time.png", gg, units="in", width=3.4*2, height=2.7*2)