Counterintuitive effects in disease transmission dynamics
Infectious diseases
nonlinearity
transmission dynamics
Author
Jong-Hoon Kim
Published
March 20, 2024
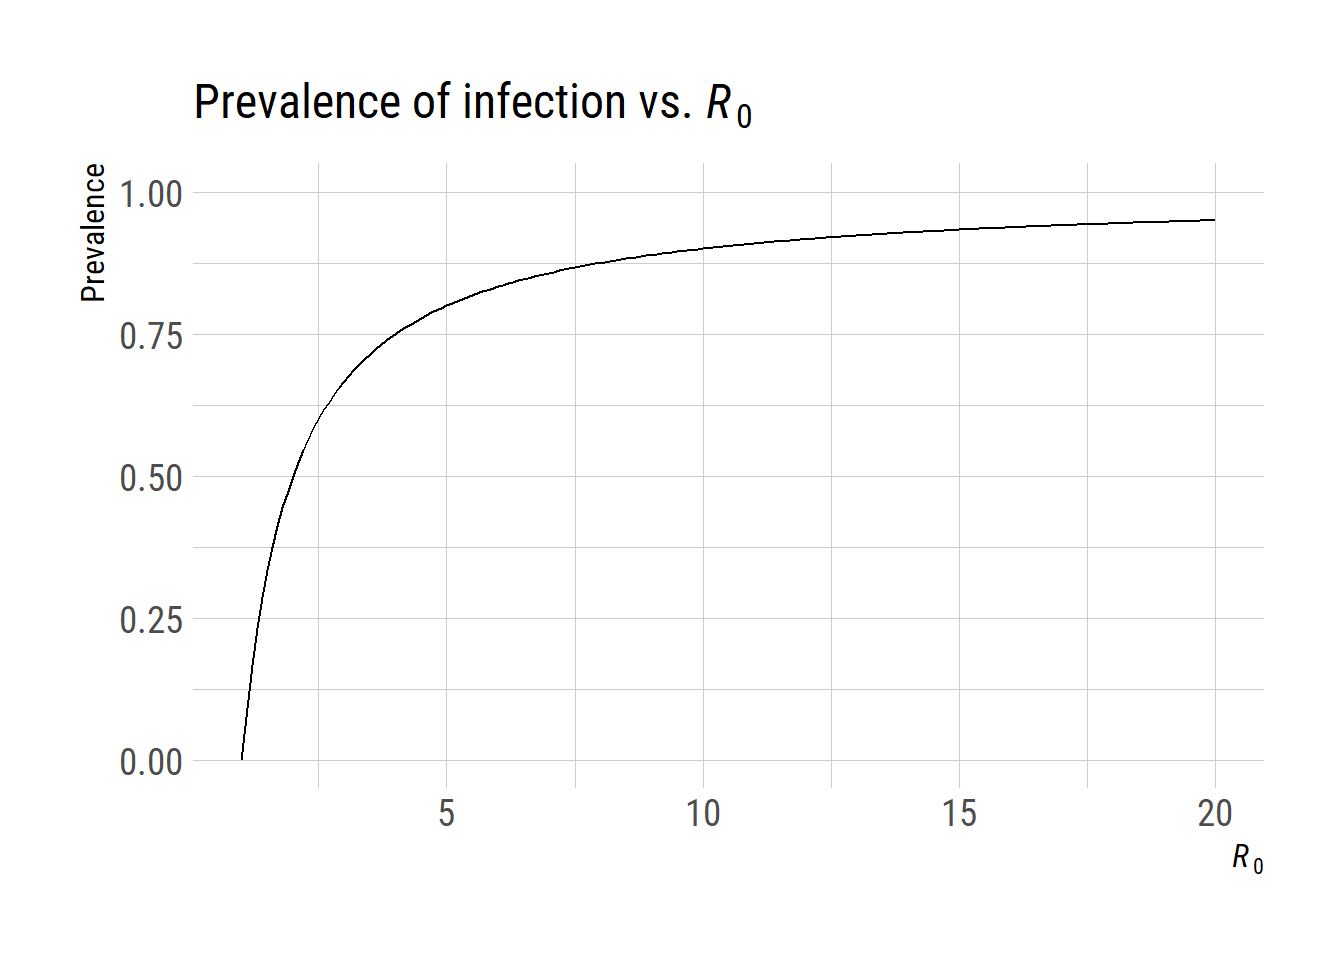
\(R_0\) and the prevalence of infection
An article by Heesterbeek et al. provides a few examples on the counterintuitive behavior of a dynamical system of disease transmission. The first example was about the relationship between the intensity of transmission and the prevalence of infection, citing the work by Anderson et al.. One message from the study by Anderson et al. is that the effect of intervention should not be measured by the prevalence of infection. A similar message can be drawn from a simple relationship between \(R_0\) and the prevalence of infection. As shown in the figure below, reducing \(R_0\) from 15 to 10 may require a lot of efforts and its effect on prevalence of infection may be small.