Convolution is a fundamental concept in mathematics and statistics, playing a crucial role in various applications ranging from signal processing to probability theory. In this blog post, we’ll explore what convolution is, its significance, and how it’s used in mathematics and statistics. Additionally, I’ll include a practical example using R.
Convolution is a mathematical operation that combines two functions to produce a third function. It’s a way of ‘mixing’ two functions, often used to understand the way a system modifies a signal. In mathematical terms, the convolution of two functions, \(f\) and \(g\), is defined as:
\[
(f*g)(t) = \int_0^{\infty} f(\tau)g(t-\tau) \textrm{d}\tau
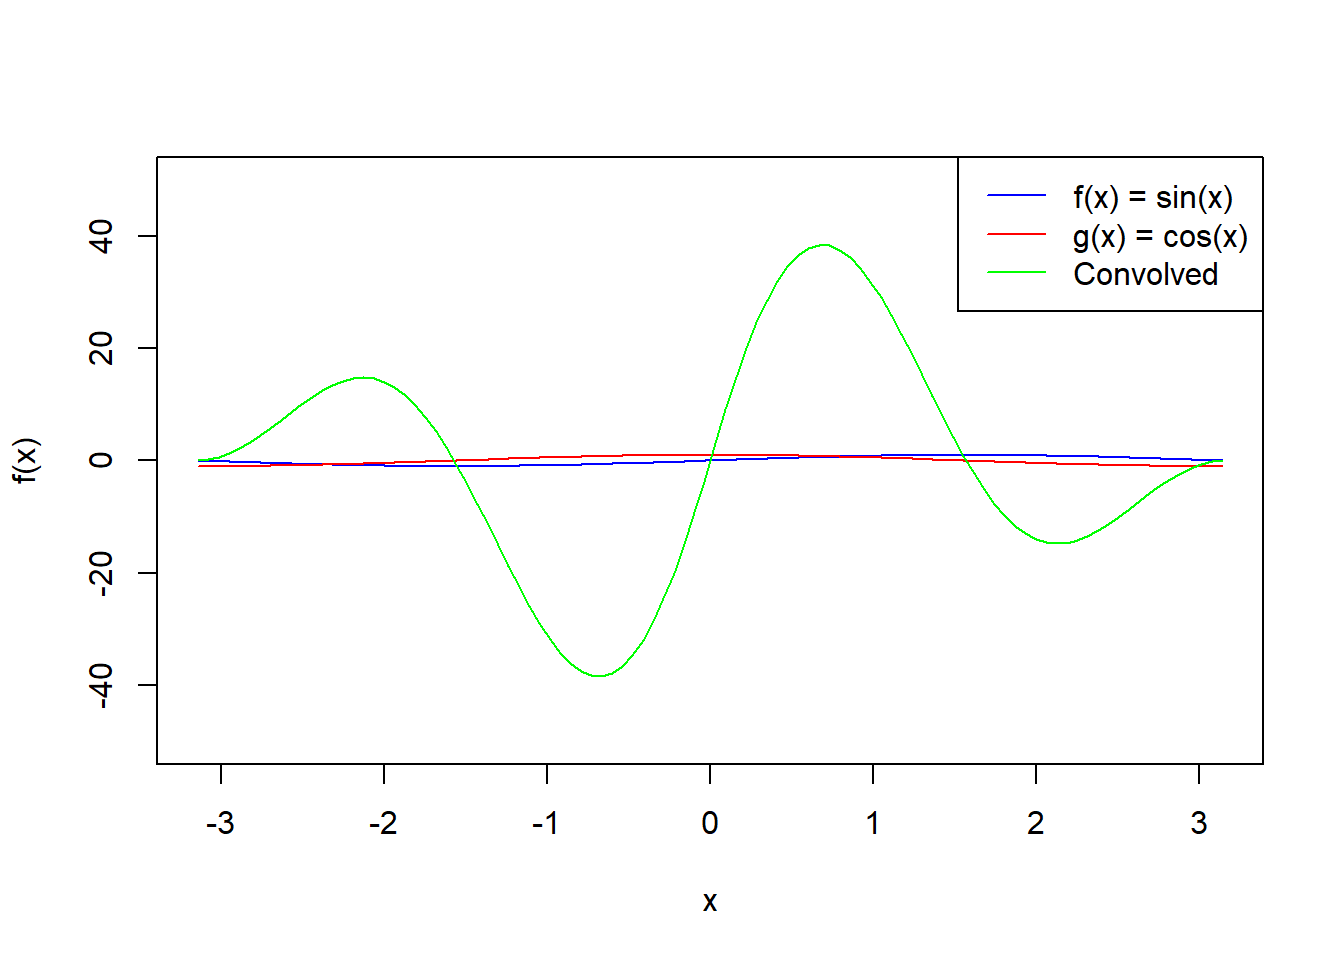
\] Let’s consider a simple example of convolution in R. We’ll convolve two functions, a sine wave and a cosine wave, to see how they interact.
# Define the two functionsf <-function(x) sin(x)g <-function(x) cos(x)# Create a sequence of pointsx <-seq(-pi, pi, length.out =100)# Perform the convolutionconvolved <-convolve(f(x), g(x), type ="open")# Plot the original functions and their convolutionplot(x, f(x), type='l', col='blue', ylim=c(-50, 50))lines(x, g(x), col='red')lines(x, convolved[seq(1,199, length.out=100)], col='green')legend("topright", legend=c("f(x) = sin(x)", "g(x) = cos(x)", "Convolved"), col=c("blue", "red", "green"), lty=1)
In compartmental modeling, it can be used to explore the distribution and features of the consecutive compartments. For example, in the SEIR model, the the length of a generation interval is given by the convolution of E and I compartments.