In the branching process model, the number of secondary infections is realized as a random number (e.g., Poission or Negative binomial).
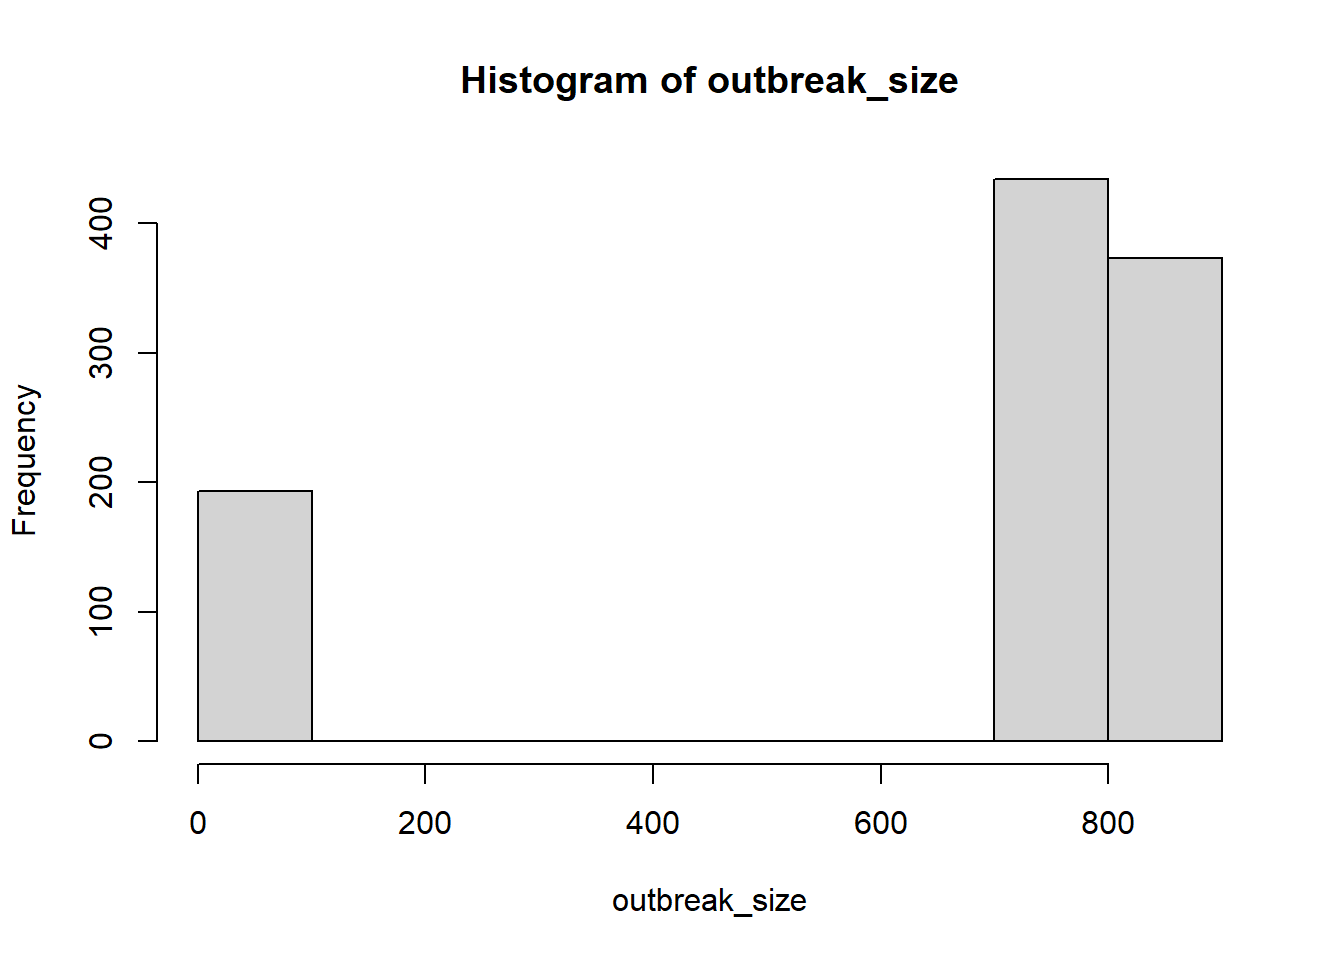
R0_mean <-2popsize =1000# population size for each iterationnrun <-1000# number of iterations to compute the meanoutbreaks <-vector("list", nrun) # to store outbreak size for each iterationinit_inf <-1# initially infected peoplefor (r in1:nrun) { pop <-data.frame(id=1:popsize) pop$status <-"S" pop$status[1:init_inf] <-"I" pop$run_id <- r pop$time_inf <-NA pop$time_inf[1:init_inf] <-0 nS <-sum(pop$status =="S") nI <-sum(pop$status =="I") N <-nrow(pop) cnt <- init_inf +1# infecteds are placed from the first positionwhile (nI >0& nS >0) { row <-which(pop$status =="I") nI <-length(row)for (i inseq_len(nI)) {# cat("i =", i, "\n") pop$status[row[i]] <-"R" offspring <-rpois(1, lambda=R0_mean*nS/N) nS = nS - offspringfor (k inseq_len(offspring)) { pop$status[cnt] <-"I" pop$time_inf[cnt] <- pop$time_inf[row[i]] +rgamma(1, shape=2, rate=1/3) cnt <- cnt +1 } } } outbreaks[[r]] <- pop}outbreak_size <-sapply(outbreaks, function(x) nrow(x) -sum(x$status=="S"))hist(outbreak_size) # minor and major outbreaksmajor_outbreaks = outbreak_size >200mean(outbreak_size[major_outbreaks])/popsize # only major outbreaks